
A look at the introduction of the new Very Fast Contingency FCAS markets
Markets
10 mins
Wholesale Market Price Data in Gridcog

Most power systems around the world include wholesale markets for trading energy. There are also markets for the ancillary market services that ensure power systems operate correctly. We’ve recently created some great short videos explaining the concepts of wholesale markets for energy and ancillary services.

Energy market prices
When you are analysing energy project opportunities, you need to incorporate assumptions regarding wholesale market prices.
One of the central features of the Gridcog platform is The Library, where all sorts of modelling assumptions live, such as project costings (capex and opex), transmission and distribution network service prices, and, wholesale market prices.
There are two main sources of wholesale market prices, which are used to populate the Library:
- There are forward-looking market pricing models. Economic consultants develop these models. They base their models on fundamentals, such as gas commodity price forecasts, demand growth assumptions, knowledge of when new transmission lines might be built, and when existing power stations might retire. Then they do market simulation that includes the bids and offers of every power station in the market.
- There is the actual historical market price data. This data is published by the various exchanges and operators of energy markets for different market jurisdictions. This data provides a ground-truth of actual market operations and settlement prices.
Gridcog enables scenario-based project assessments, and so our users will often use both these kinds of pricing data in their models.
Sourcing energy market data
While our users could go off to the many different market operators to download historical data and upload it into our Library, we want to make life a little easier.
So, another central feature of the Gridcog platform is Feeds, which we use to automatically integrate with the various operators of energy markets around the world, such as the following:
Many of these operators cover multiple markets for multiple market services and multiple market jurisdictions. For example, in Australia, AEMO operates the National Electricity Market (NEM) and the Western Australian Energy Market (WEM).
In the NEM we have zonal energy pricing with a seperate physical ‘spot’ market for energy in New South Wales, Queensland, Victoria, South Australia, and Tasmania.
We also have ten different frequency control ancillary services markets for each of those zones. So that’s 55 different sets of market prices that vary every 5 minutes for just one of the jurisdictions covered by one of the market operators.
Staying in the southern hemisphere, New Zealand has nodal rather than zonal pricing, so that’s more than 200 different wholesale energy pricing nodes, along with the NZ reserve markets for frequency regulation.
When we move to the UK and Europe, there are quite a few pan-European market operators covering the trading of energy of across different timescales. ENTSO-E, for example, publishes Day Ahead wholesale price data and ancillary service price data (i.e. FCR and aFRR) for much of continental Europe.
However, due to the many wholesale markets operating in the region much of the wholesale price data comes from EPEX and Nordpool - these are the platforms that host Day Ahead and Intraday auctions and continuous markets. For example in GB there are 6 different wholesale markets that can be traded on these platforms between Day Ahead and delivery.
In GB, System Prices and Balancing Mechanism (BM) data is published by Elexon - there is a different BM Bid/Offer price set for every asset participating in the BM. Whereas ancillary service price data, where the service is procured by National Grid ESO (TSO), for example Dynamic Containment is published by NGESO.
Dealing with energy market data
Dealing with this data is quite difficult because it comes from a wide variety of sources in a wide variety or formats (of varying quality and usability).
For example AEMO provides historical data for the NEM in relatively convenient monthly csv files, packaged in zip files. But if you’d like to use the most up to date data from within the current month, this is provided in a separate csv files for each 5 minute period.
On the other side of the country, AEMO recently overhauled the market data system as part of the WEM Reform. Previously market data was tabled in annual or monthly csv files, now the data exists in daily JSON files.
Is JSON a little too modern for your tastes? ENTSO-E packages up data in a convoluted XML format, which can only be described as painful.
However nothing beats the honesty from Transpower, the market operator for the New Zealand Electricity Market. They provide data in convenient monthly or daily zipped collections of csv files, but without a genuinely amusing caveat on the quality of the data.
.png)
Every day our Gridcog Feeds connects to each of these market operators and downloads raw historical market data. This data is validated, cleaned, standardised, and automatically uploaded into the Library so it can be used in Gridcog project models.

Using market price data in your projects
While you can always upload your own price data, or price data you source from 3rd-party economic consultants, Gridcog also makes it easy to use the historical market data we source automatically with Feeds within your projects.
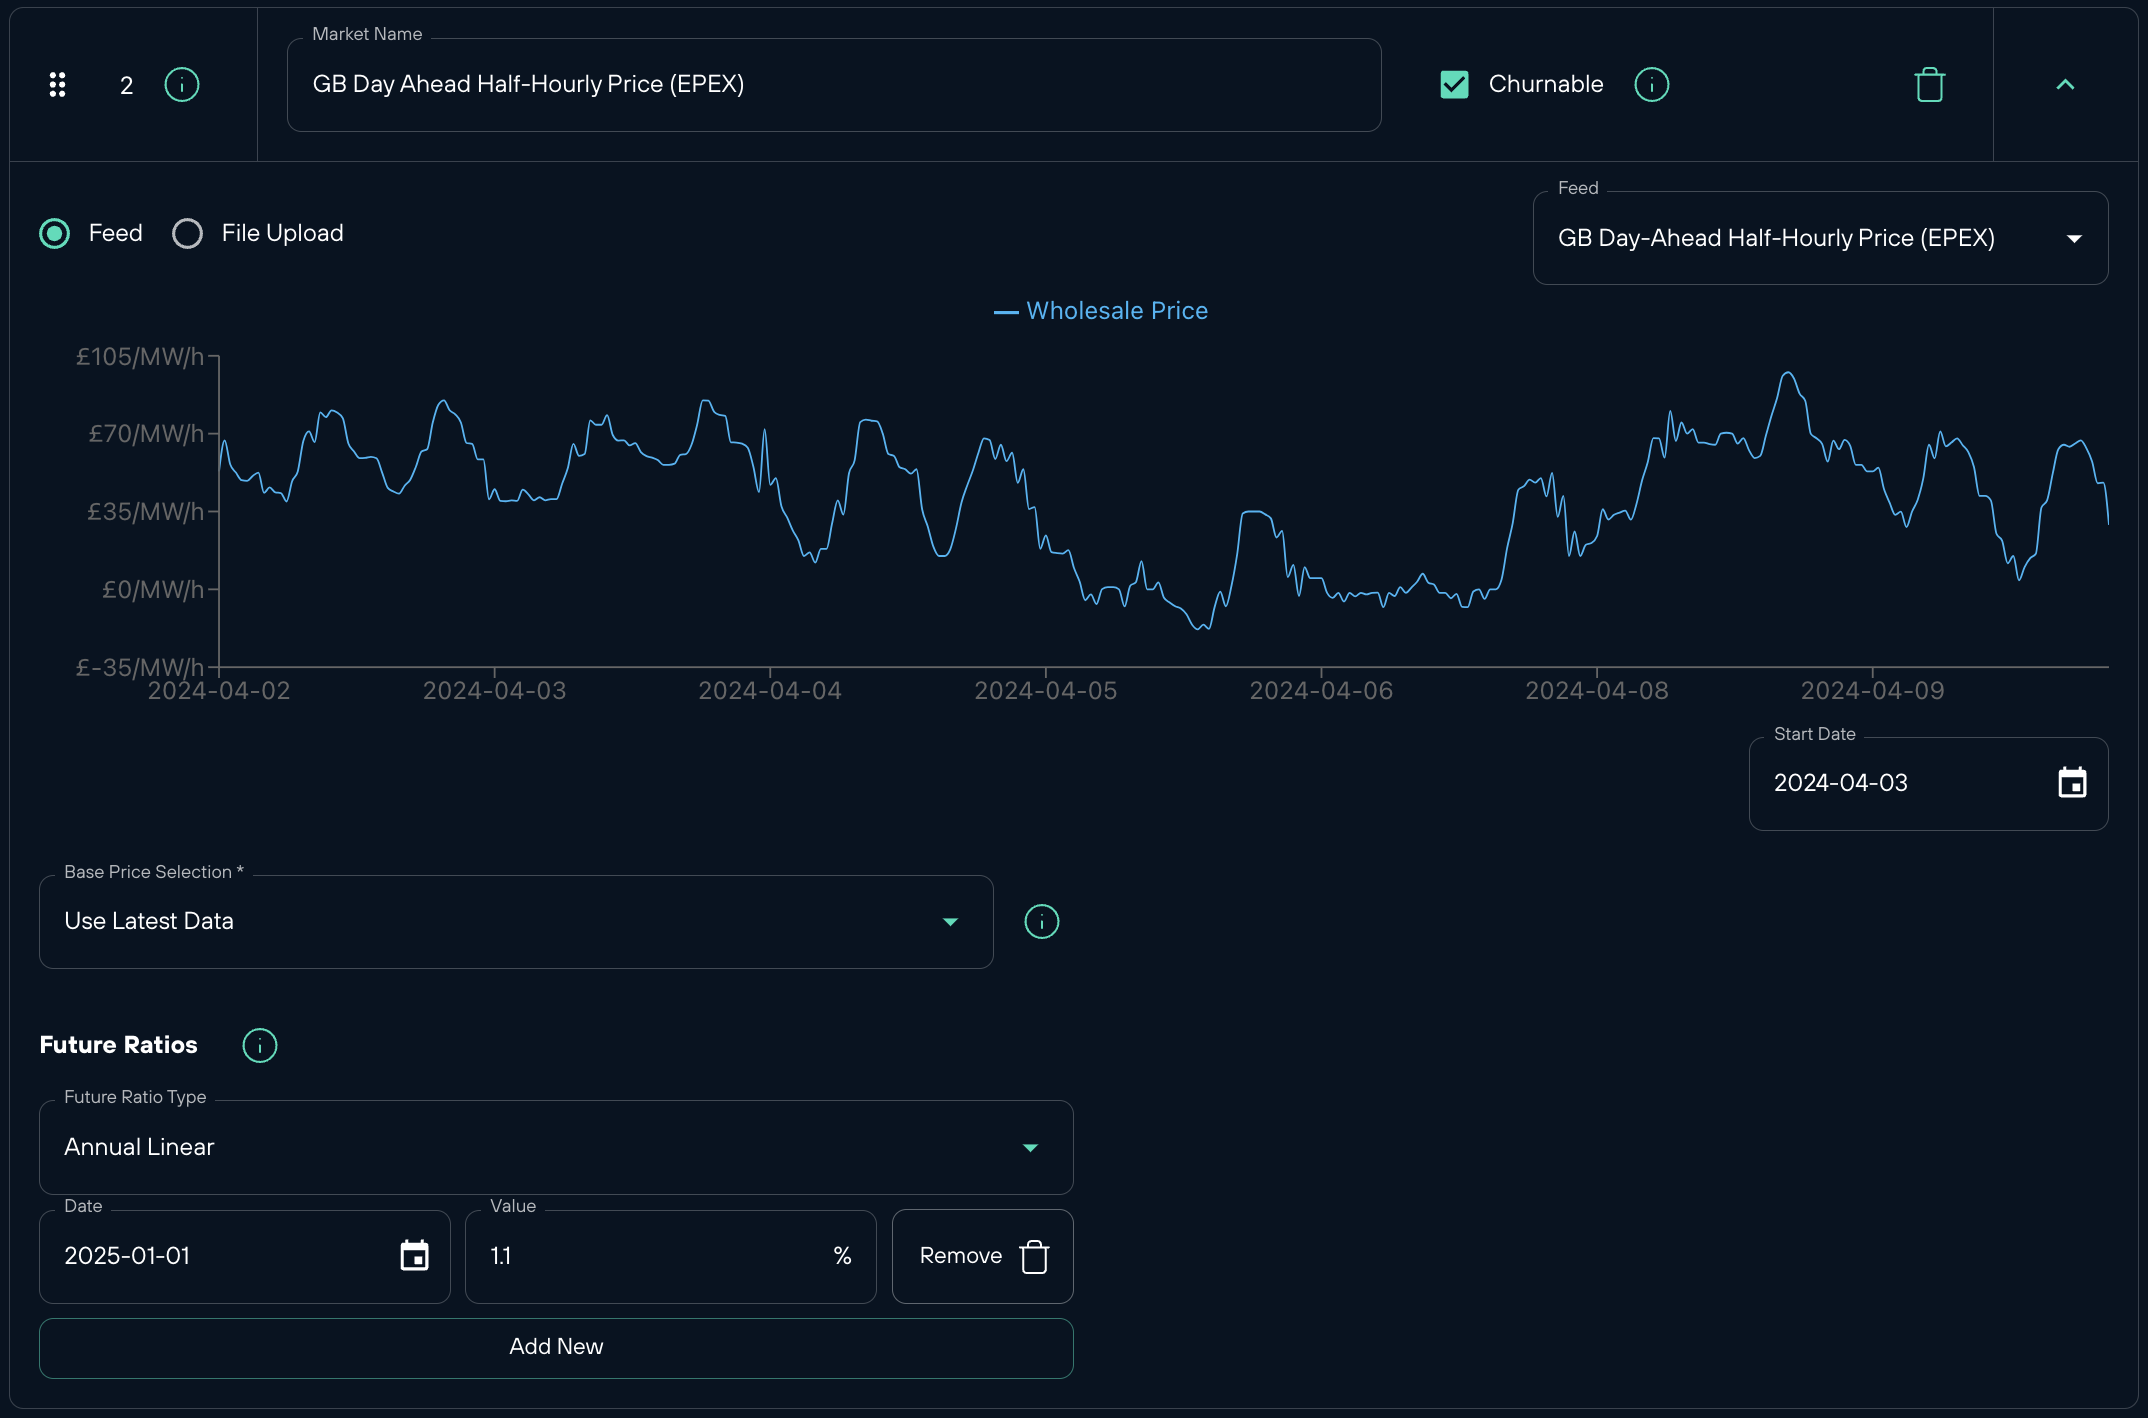
This includes being able to configure what period of historical data should be used in your project model and how it should be ‘cast forward’ into the future.
For example you might choose to use the latest market data from the last 12-months, or some specific historical periods you think are more relevant for the purpose you are modelling. Or you might decide that you want to escalate, deescalate, or transform historical prices in particular ways.
And across different scenarios in your model you might test your project concept against different market pricing assumptions to assess the spread of financial outcomes your project might achieve.
An integrated solution for multi-market modelling
Automatically providing access to historical market price data is just one of the ways we provide an integrated solution for modelling energy projects across different energy markets around the world.
Whether you are modelling a residential virtual power plant, an EV charging network, an industrial microgrid, a community solar farm, a utilty-scale battery, or anything else, wholesale market price data will be an essential part of your project model, and Gridcog provides an integrated solution to makes it easy.
Feel free to reach out for a demo if you’d like to find out more.

Fabian Le Gay Brereton
April 11, 2024

