
Take a look at the 'duck curve' in Australia's electricity demand, driven by increasing rooftop solar installations, and explores its implications for grid stability, pricing dynamics and opportunities for flexible load management.
Distributed Energy
7 min read
UK Residential Solar PV Payback Analysis
Introduction
Our previous post looked at the difference between what a residential solar owner in London might be paid under the various SEG export tariffs and what that energy would be worth on the balancing market. We found that the export tariffs on offer were much lower than both the very high wholesale prices and the import tariffs (for energy consumption rather than generation) that the suppliers are offering to customers.
However, installing a PV system could still be a good investment for households who self-consume the majority of generated energy and so reduce the amount of energy purchased from their supplier. With the current energy price guarantee at an eye watering 34p/kWh from October 1st, solar is becoming an increasingly attractive option for many households.
Assumptions
We modelled out the following assumptions in the Gridcognition software to see how long it’d take to pay off the investment in a new residential solar system:
- The total annual consumption for our typical household is about 5MWh. 30-min resolution interval data provided by the Greater London Authority.
- The property is located in SE London. We get solar irradiance data for a typical meteorological year from Solcast.
- Sensitivity to solar system size assessed using 1kW, 2kW, 3kW, 4kW and 5kW, all oriented 180° south at a tilt of 35°.
- Sensitivity to energy supply costs assessed using 16p, 20p, 24p, 28p and 34p per kWh. That more or less bookends the pricing from the lows of the Covid era to October’s price cap.
- Model is run both with and without export under an 15p/kWh Smart Export Guarantee (SEG) tariff. That’s the best fixed rate available on the market today (Octopus Energy’s Fixed Outgoing tariff).
- Solar capex costs assumed to be £1,300 per kW.
Results
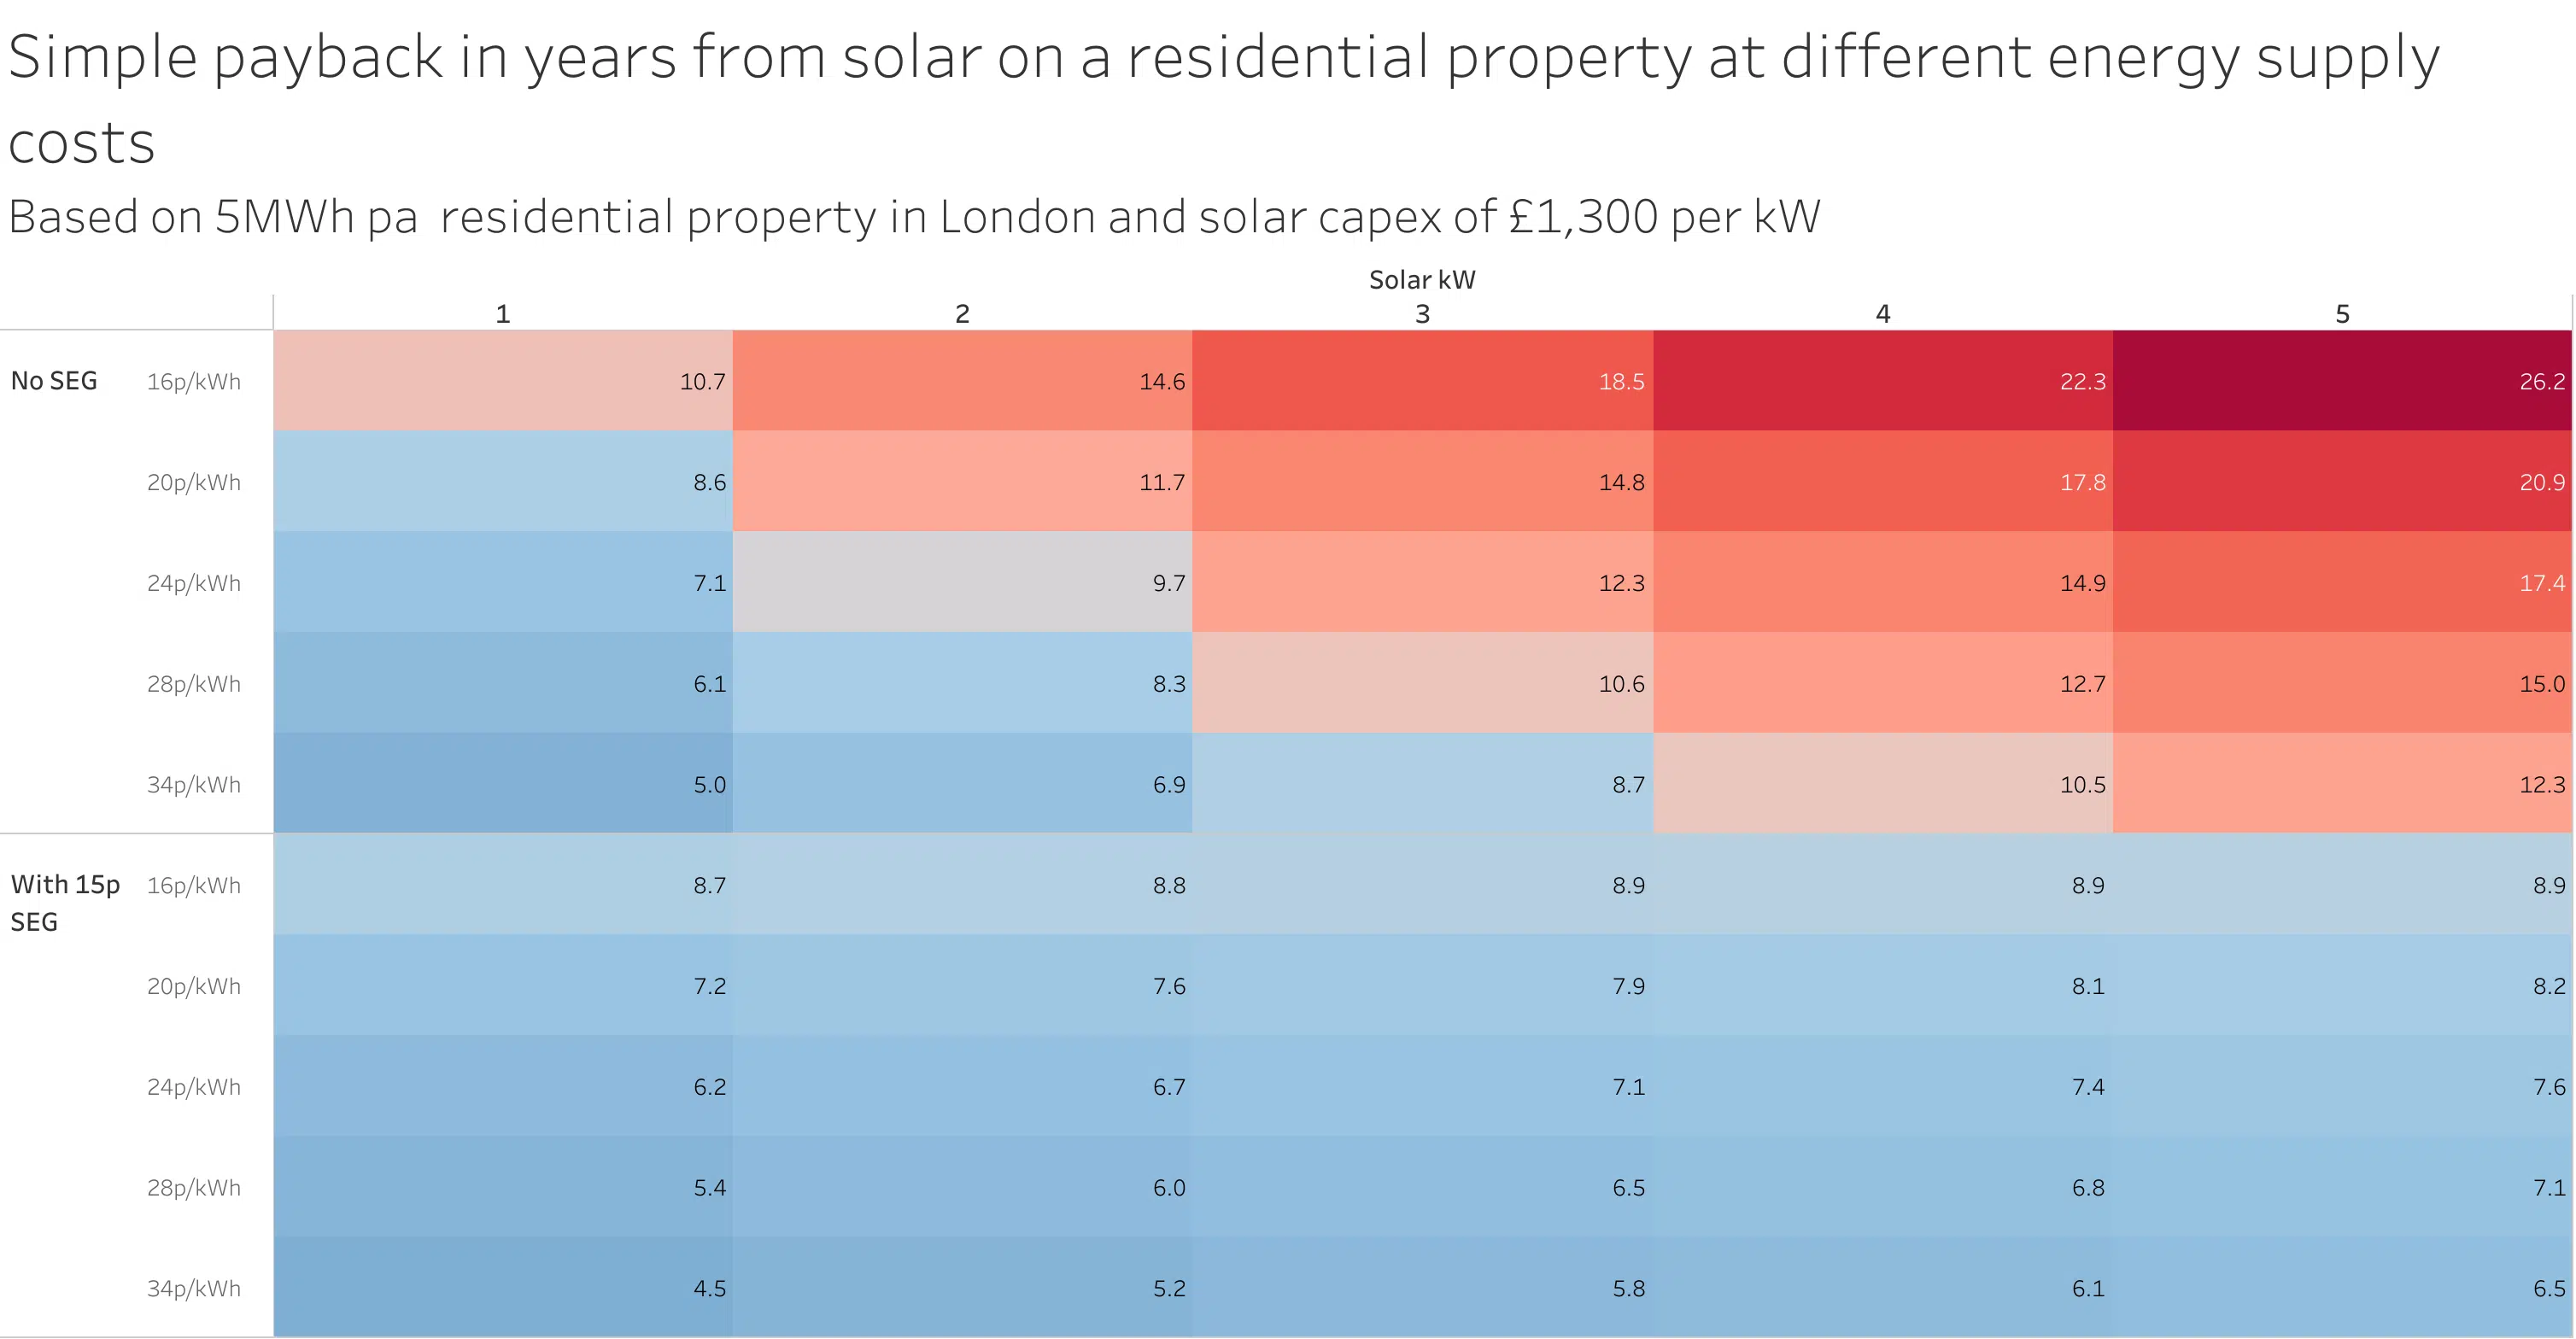
The payback period is very sensitive to both the import and export tariffs, as you may expect. At one extreme, a 5kW array with a 16p/kWh import tariff and no export tariff would take 26.2 years to pay off, which is beyond the rated lifespan of many panels. At the other extreme, a 1kW array with 34p/kWh import and 15p/kWh export would be paid off in 4.5 years.
Since payback time will often favour lower capex at the expense of longer-term value, let’s also take a look at NPV after 10 years, based on a 5% discount rate:
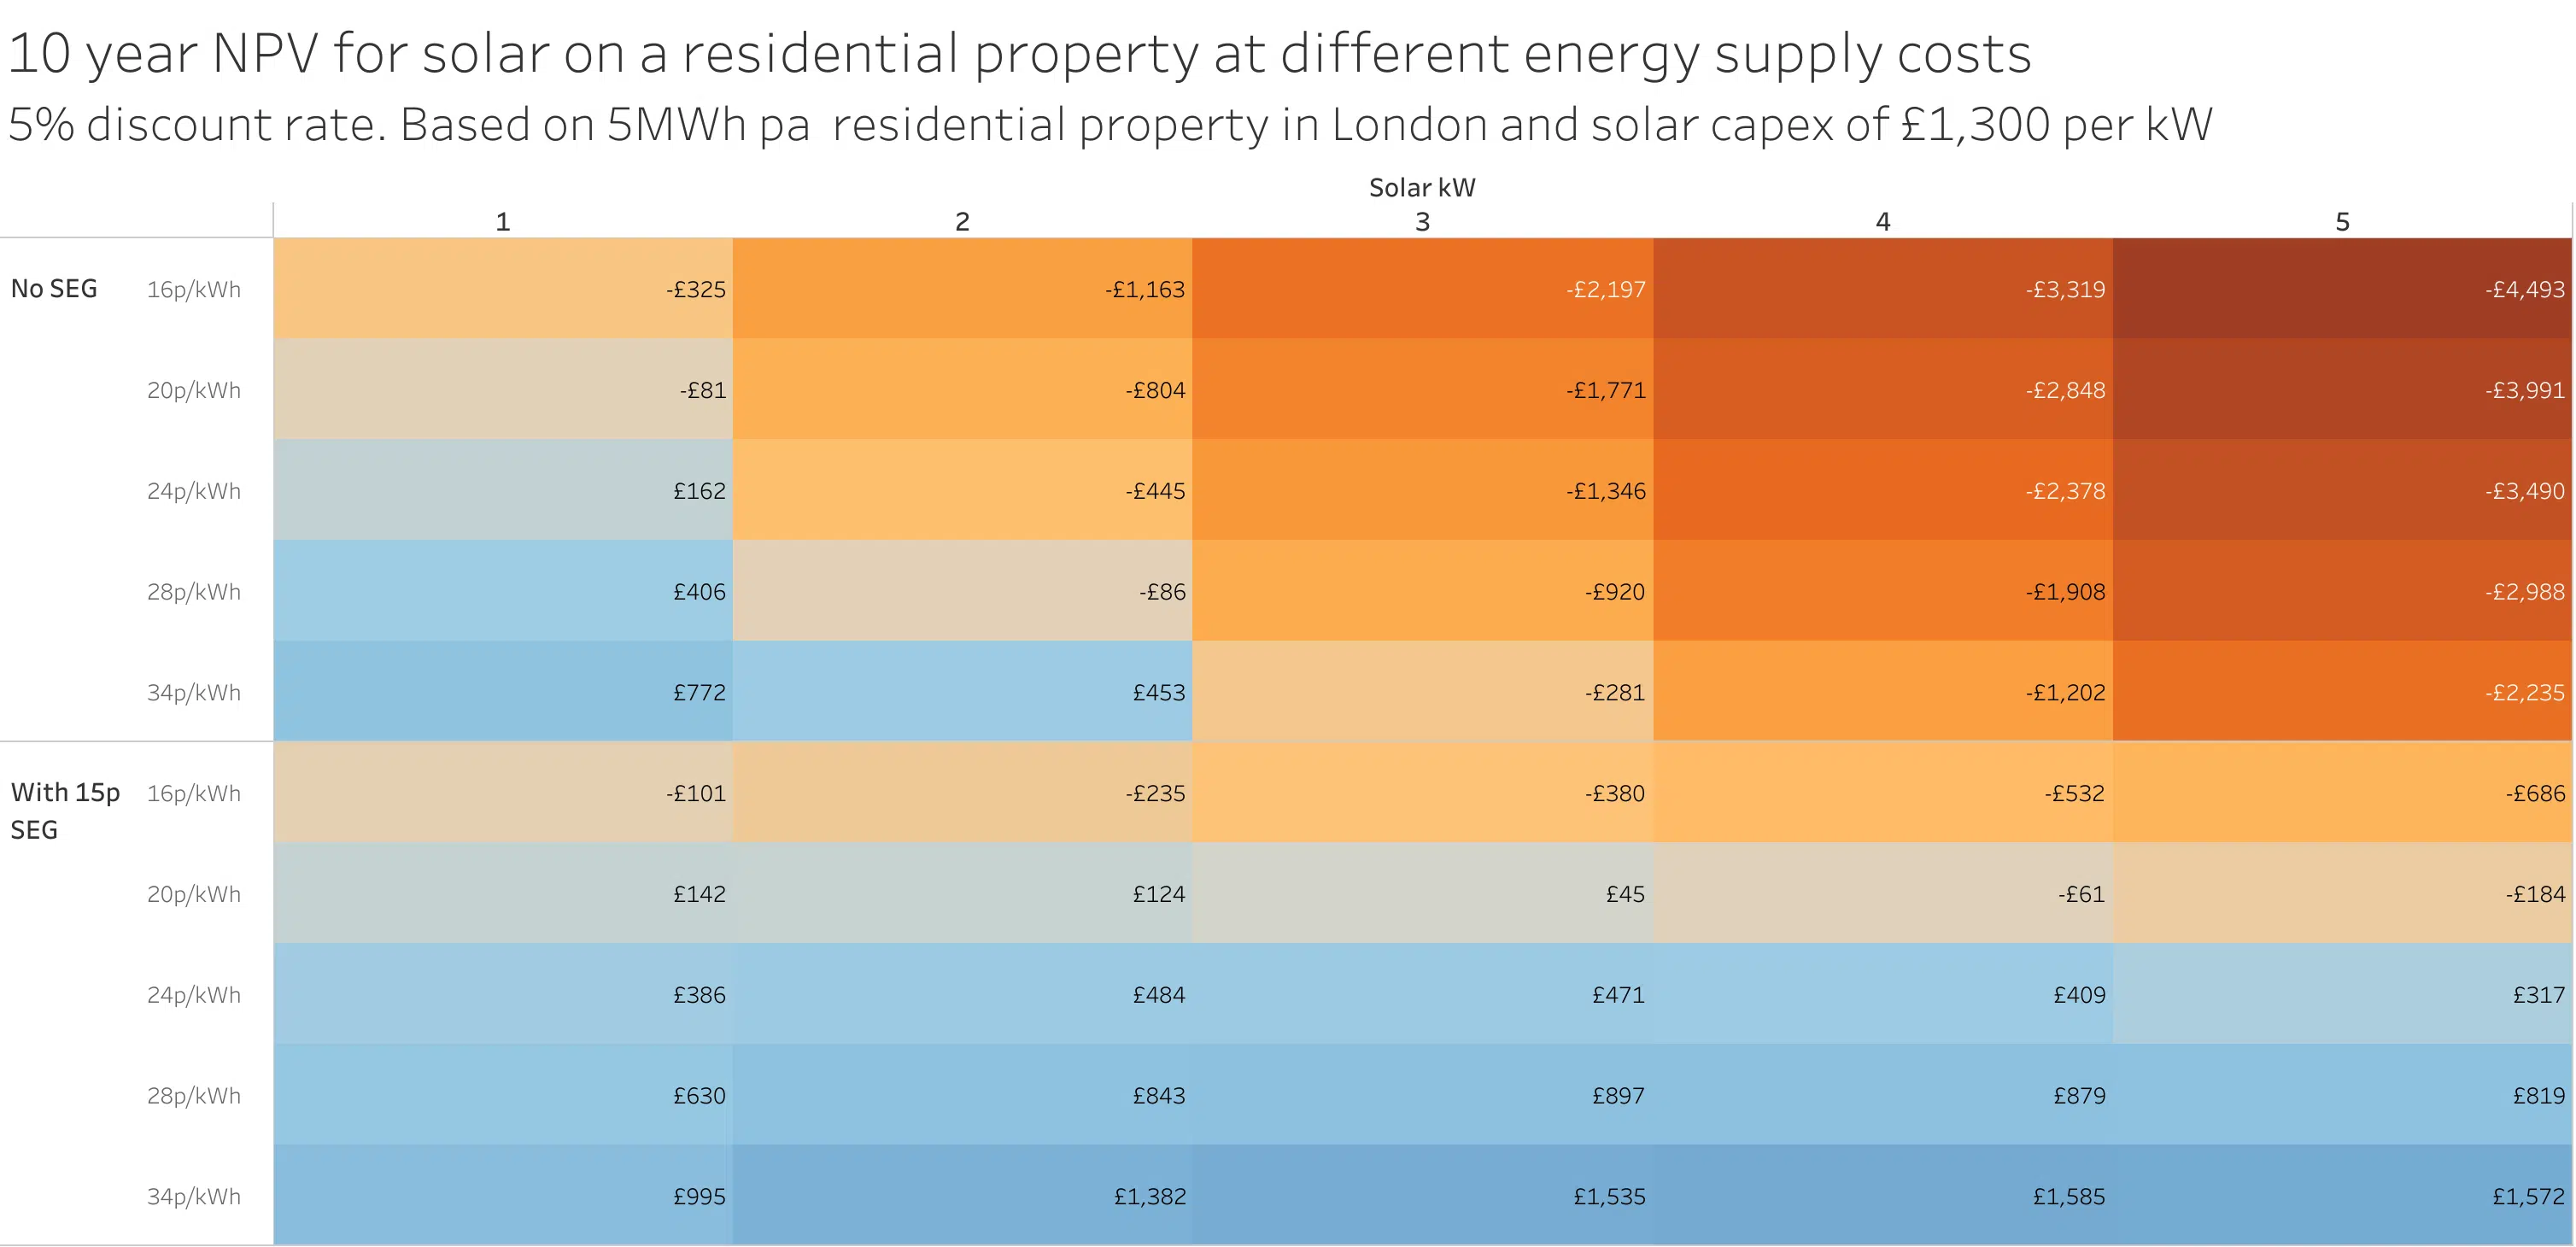
Even without an export tariff, any size of solar array is a worthwhile investment if import tariffs stay at their elevated rate of 34p/kWh and excess generation can be sold at 15p/kWh. For systems without any export, only arrays sized at 1kW or 2kW will have a positive NPV after 10 years.
Interval data
Here’s a closer look at the energy flows for a 3kW system during the month of June.

In a typical week in summer, the PV system is exporting significant amounts of energy to the grid, and also reducing peak demand by just under one third.

Even in winter, the PV system is exporting some excess generation to the grid on sunny days, but isn’t making much of a dent on consumed energy or peak demand.
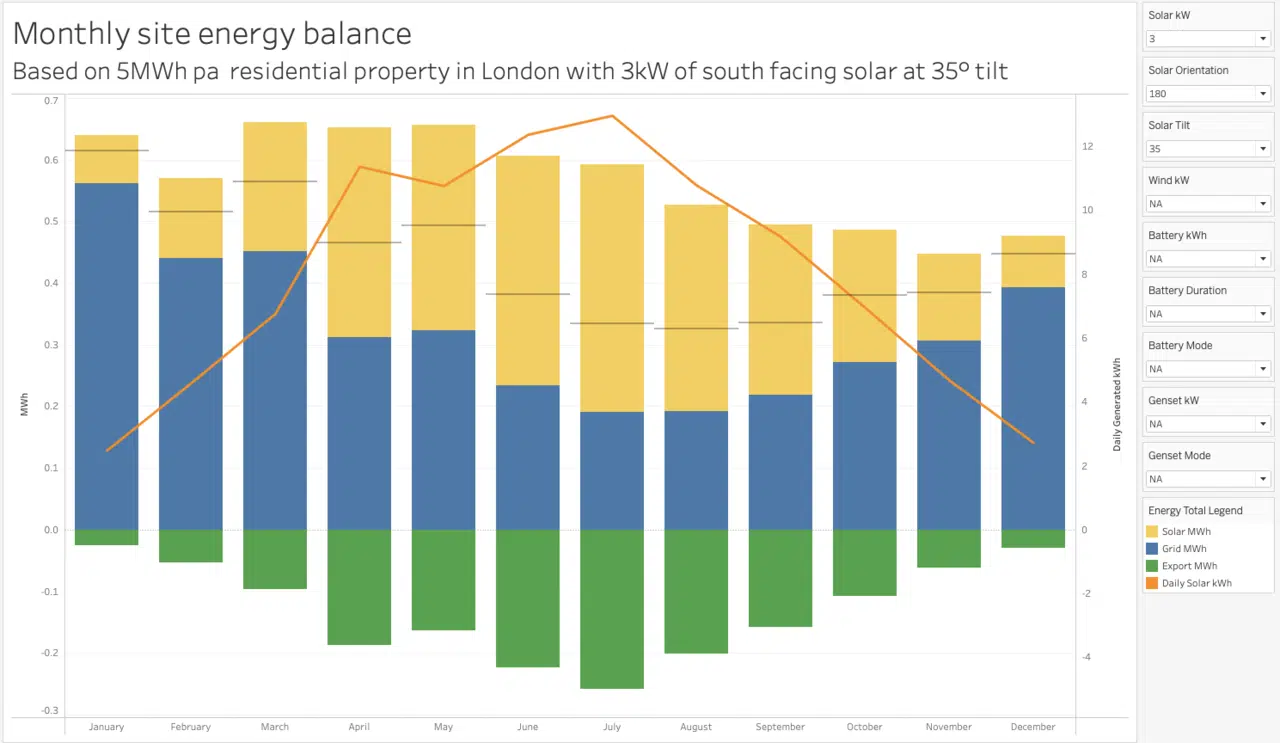
Across the year, a significant portion of the house’s energy demands are met by the PV system.
Analysis
- Assuming the import rate remains at 34p/kWh (and that’s a big assumption), a 4.5 year payback period for a 1kW system is a great deal. If you can afford (or get financing for) a small solar array and you have a suitable roof, it’s probably a good investment.
- At 34p/kWh, any size PV system gives a positive return after 10 years (assuming an export tariff of 15p/kWh).
- There’s a huge amount of uncertainty in future energy prices. They’ll be impacted by both unpredictable global events and also government interventions in the energy market. Making investment decisions based on forecasted prices obviously carries risks. On the other hand, households may like the fact that generating their own energy reduces their exposure to volatile and unpredictable energy markets.
Are Increasing Wholesale Prices Impacting Solar Installations?
Another way to answer the question of whether PV systems are a good investment is to look at whether new systems are actually being deployed. Fortunately, the Department of Business, Energy and Industrial Strategy publishes monthly figures of new solar capacity installations, broken down by deployment size.
Here’s the monthly small-scale (<50kW) installations in the UK over the past 12 years:

It’s been quite a rollercoaster for the UK residential solar industry! The peaks in early 2012 and 2016 coincide with changes to rates and rules of the FiT scheme, and the huge outlier in March 2019 lines up with the end of the scheme and the rush to get installations accredited before the deadline of April 1st. Since that date, small-scale solar installations have been growing steadily without subsidies, with just a small blip down in early 2020 during the COVID lockdowns and a noticeable uptick since the beginning of 2022.
Let’s zoom in on the last three years and compare installations with Australia, which has a much larger and more mature residential solar industry. We took June 2019 as a baseline to avoid any distortions caused by the ending of the FiT scheme, since it’s likely that many installations were brought forward to meet the deadline and inventory and sales pipelines would be drained for a few months afterwards.
The Australian data was taken from Sunwiz, and includes all systems up to 100kW. The comparison therefore isn’t exactly like-for-like, but is directionally correct.

Australia starts from a much higher baseline of 178 MW of installation per month. However, there’s only moderate growth in rate of installation, with ~200-300MW for most of the period. Still, that’s around 3GW of new installed capacity per year!
The UK, on the other hand, starts from a much lower baseline of 8MW in June 2019, but rises to 56MW in September 2022. That’s an increase of over 650%.
Conclusion
As energy wholesale prices continue to be elevated and volatile, and retail tariff rates reflect those high prices, households’ economic case for residential solar installations will only grow stronger. Even without feed-in tariffs or SEG tariffs that accurately reflect the fair value of exported energy, it’s likely that more and more households will install small-scale solar generation to save money on their energy bills.
At Gridcognition, we’re able to model and simulate DER deployments that include solar, wind, battery storage, EV chargers and other assets, across multiple sites, markets and jurisdictions. Contact us if you’d like help modelling your DER deployment!

John Newbery
December 9, 2022
.png)
