.png)
Explore the 24/7 Carbon Free Buildings project. Learn about the project and join the free online launch event on April 27th, 2023.
24/7 CFE
3 min read
Optimising the environmental performance of distributed energy assets
For many organisations (like Google with their commitment to 24/7 Carbon-Free Energy) optimising the design and operation of their DER assets isn’t just about dollars and cents; the environmental return is just as important.
Increasingly, organisations and entire countries are committing to zero-emission targets – Australia is an embarrassing omission from this growing list – and reducing the use of emissions-intensive grid-supplied electricity is a key focus.
For owners of behind-the-meter solar and storage, one way to think about this challenge is as a form of arbitrage; not the traditional type where you might charge your battery when energy costs are low and discharge into a later and more expensive period, but rather a CO2 arbitrage where you look to deploy your own low-carbon energy resources when grid-supplied emissions are high and perhaps keep them in reserve (by storing BTM solar generation) when grid-supplied emissions are lower, which occurs when a large chunk of the grid is being supplied by renewable sources such as wind, solar or hydro.
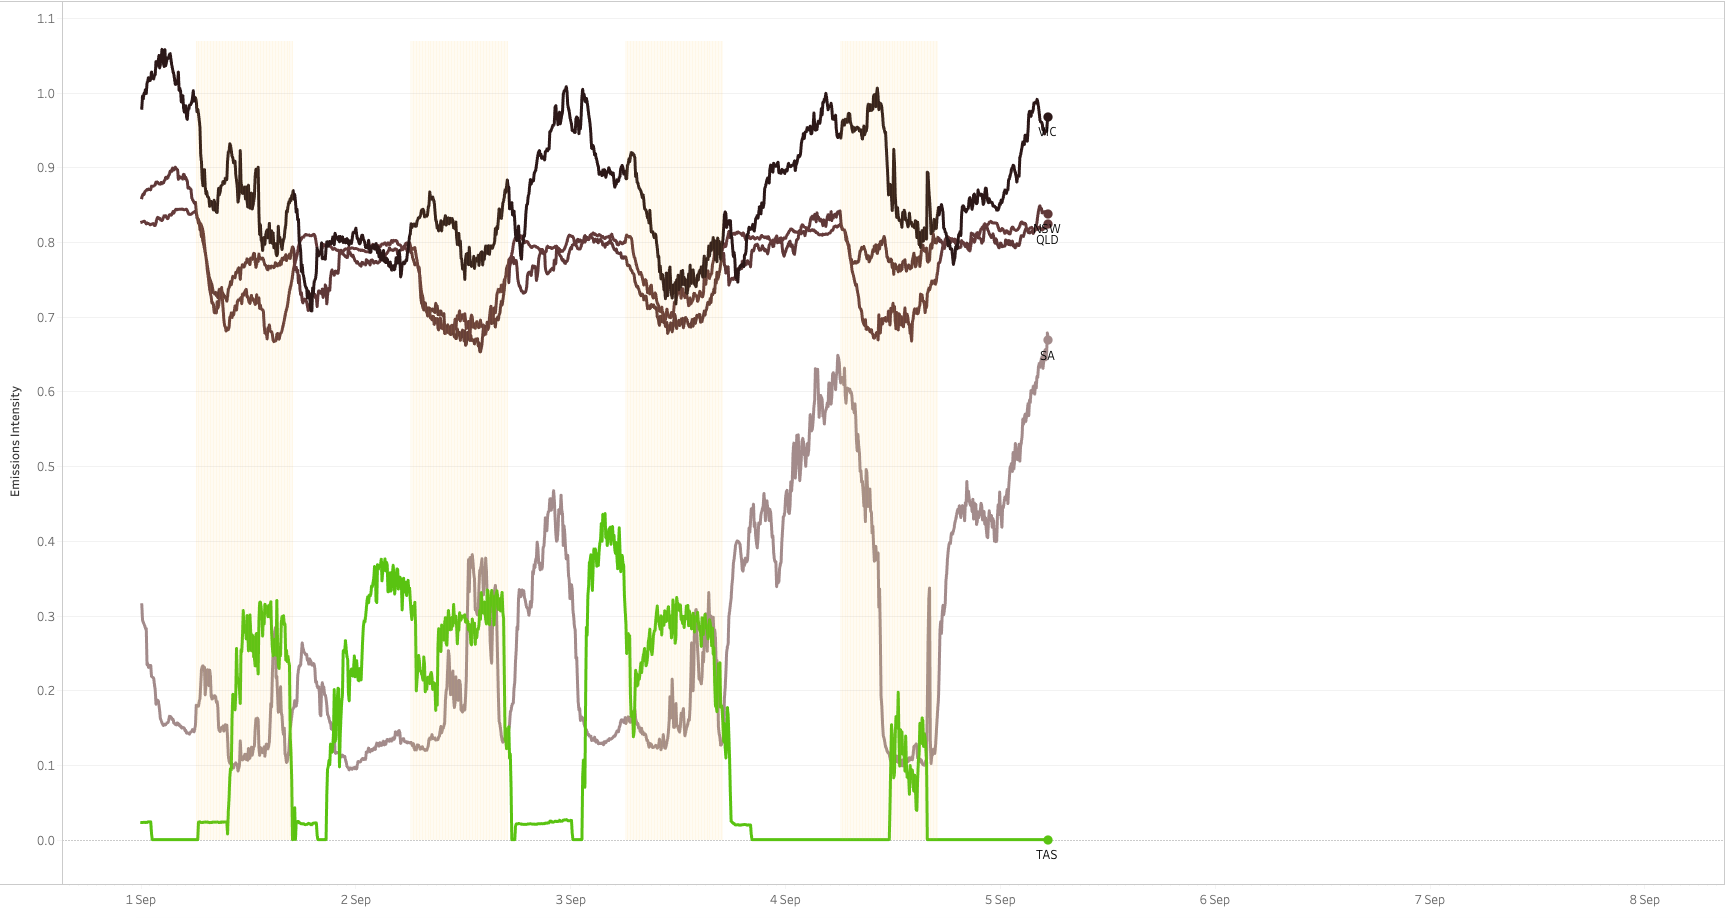
To help illustrate this concept we looked at a week’s worth of emissions for the Australian NEM from September 2020. This is created by taking the 5-min generation data for each of the dispatchable generators in the NEM, which is published by AEMO, and incorporating the emissions intensity of each of those generators. The resulting figures are volume weighted region-level emissions intensity values represented as kg carbon dioxide equivalent per kWh. Included in the data are the energy flows through the interconnectors, the transmission infrastructure that allows electricity to flow between adjoining States.
This is clearly visible in the Tasmanian numbers when they’re taking dirty electricity from Victoria. Interestingly this often seems to coincide with lower carbon intensity in South Australia which is presumably a result of the pricing dynamics that flow through to Victoria on windy and/or sunny periods in SA.
We’ve also highlighted daylight hours, they’re the pale yellow bands in the bottom chart, to help identify when large-scale solar will be operating. You can see a subtle but clear pattern, particularly in NSW and QLD, with emissions intensity dropping 15% to 20% when the sun is up.
In the absence of a national net-zero target it will continue to fall to the State and Territory governments, local councils and businesses to drive the No Carbon agenda in Australia and with the emerging capabilities of distributed energy resources they now have another tool at their disposal. For our part at Gridcognition, we’re building emissions optimisation into our DER digital twin platform to enable customers to understand how best to design and operate their energy assets to deliver the best commercial and environmental outcomes.

Pete Tickler

