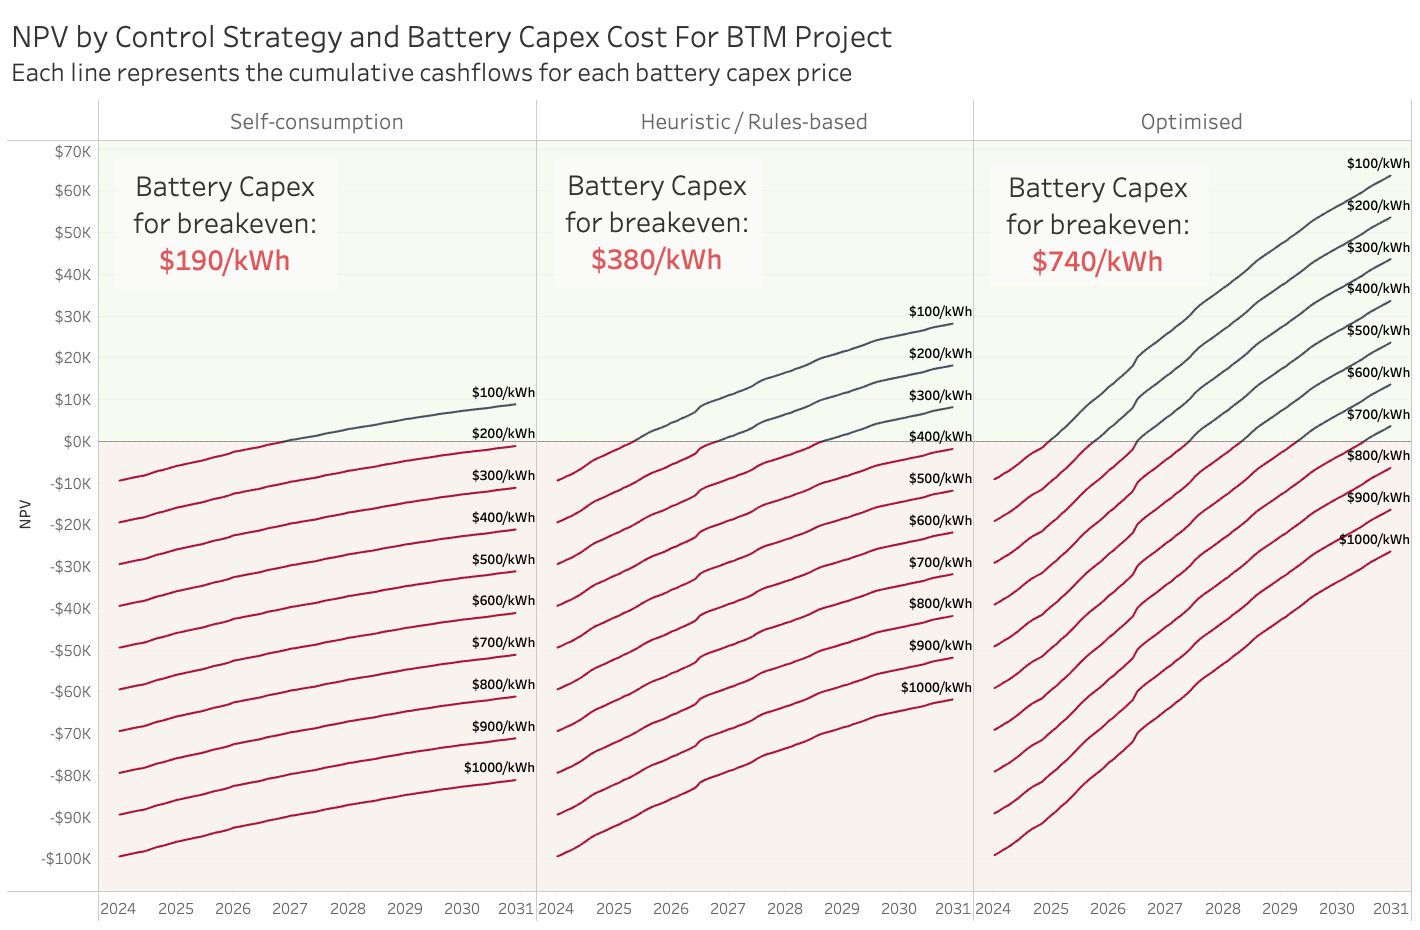
Pete Tickler uses Gridcog to test the impact of different battery control strategies by running near-identical versions of the site where the only thing that varies is the way the BESS is controlled.
Battery Storage
10 min read
Maximising battery value: a commercial analysis of front-of-meter vs behind-the-meter storage

There’s a healthy debate underway in the energy sector around where battery energy storage assets should be located within electricity systems, in order to create the greatest possible value, both for their owners and for society more broadly.
As a general rule, the further downstream storage assets are positioned within electricity networks, the greater the number of value streams they can access and so the greater the potential commercial return. The Rocky Mountain Institute has created a much-reproduced graphic which tells this story quite nicely and which you can find here.
One of the major benefits of batteries that are co-located with load – this is, installed behind-the-meter (BTM) at a home or business – is that they can reduce the owner’s exposure to transmission and distribution network costs remembering that network charges make up between 30% and 60% of a typical bill. These assets can still provide many of the ‘upstream’ services that front-of-the-meter (FTM) batteries typically target, such as wholesale market arbitrage, network support and frequency management, albeit with some additional wrinkles associated with market access, price signals and physical constraints.
By contrast, FTM storage can come in a number of forms, including co-located with solar and wind farms as a means of ‘firming up’ generation and/or providing the opportunity to sell into higher market prices, or as an alternative to building out the transmission network, but one use-case that’s got some momentum is the idea of storage directly connected to local distribution networks.
The principle is that these battery assets can provide localised network support – they offer an alternative and more flexible way of upgrading the LV network to support the changing needs of electricity distribution – and when not on network support duty can also be made available to market participants to capture market-related value. Importantly, there’s an argument that these assets can be larger and more cost efficient that their BTM cousins, at least relative to residential storage.
Pretty much every Distributed Network Service Provider (DNSP) in the world is looking at this opportunity, certainly all the Australian networks are, and a couple, Ausgrid in NSW and Western Power in WA have got as far as real projects (there might be some other live projects we’re not aware of). In the case of Western Power they’ve already got storage assets deployed out in the field.
There’s a fair bit of conjecture around whether a battery deployed FTM or BTM will deliver the greatest return. Often that debate is coloured by the natural biases of the parties involved – for example, you won’t be surprised to hear DNSPs argue that network connected storage will deliver a greater return compared to the same asset located behind-the-meter. They might be right, but it’s hard to take that opinion too seriously when most networks make their money by expanding their Regulated Asset Base (RAB).
To try and get past the rhetoric we thought we’d use the Gridcognition digital twin software to simulate BTM and FTM battery storage assets to see which might be able to capture the most value. As always for this kind of exercise we’ve had to make a number of assumptions in the modelling but we think the approach is reasonable based on actual projects we’ve been involved in.
Analysis Approach
For this exercise we’ve simulated BTM and FTM storage across six different scenarios, three in the Wholesale Electricity Market in WA (WEM) and three in the National Electricity Market on the east coast (NEM). The reason for this is that the two markets operate in very different ways and this has a significant bearing on how batteries can capture value. To keep the comparisons consistent we’ve compared the same sized battery assets in each scenario, but the same analysis could be run comparing one larger FTM battery with multiple smaller BTM batteries.
You can summarise these scenarios as follows:
- Scenario 1: NEM BTM – battery co-located with a commercial load
- Scenario 2: NEM BTM + Solar – as above but with the addition of a BTM solar PV system
- Scenario 3: NEM FTM – battery connected directly to the LV network
- Scenario 4: WEM BTM – battery co-located with a commercial load
- Scenario 5: WEM BTM + Solar – as above but with the addition of a BTM solar PV system
- Scenario 6: WEM FTM – battery connected directly to the LV network
Assumptions for physical modelling:
- For all scenarios we’ve modelled a 232kWh / 116kW (2-hour) li-ion battery with 90% round-trip-efficiency and 90% usable capacity.
- For the BTM batteries we’ve assumed the load shape of the site to be a medium sized commercial property with Monday to Friday operations. The same underlying load shape is used for all BTM scenarios and we’ve modelled against a full 12 months of 30-minute interval data.
- For the BTM batteries co-located with solar, we’ve assumed 150kW of north facing panels at 10° tilt. We’ve used local irradiance from the Bureau of Meteorology based on postcode 6000 (WEM) and 2000 (NEM). No value is ascribed to the solar, we’re simply using it to modify the underlying site load shape that the battery is working with.
- All BTM batteries are not allowed to export.
- WEM BTM assets are connected to the Western Power network and on tariff RT6. NEM BTM assets are connected to the Ausgrid network and on tariff EA305. These tariffs are the likely choices for the load shape of our site.
- FTM assets are assumed to be connected to the low voltage distribution network and have no restriction on import or export (charge/discharge)
Assumptions for commercial modelling:
- Battery capex and opex costs – these have been ignored so as to focus on the value capture side of the equation. That said, from projects we have visibility of there’re minimal difference in these costs between BTM and FTM for the same size and spec of battery.
- Network charges – BTM batteries are subject to the relevant network tariff for the respective DNSP. FTM batteries pay no network charges.
- Network support services – both BTM and FTM batteries are able to earn revenue by providing network support during ‘system low’ events. That is, periods of the year when grid demand falls to such low levels as to risk stability of the distribution network. In this case we’ve assumed the battery earns that revenue by charging flat out during peak-solar hours (10am to 2pm) on weekends in spring and autumn. This mimics the current Western Power trial and is probably broadly relevant to any DNSP with high penetrations of behind-the-meter solar, which is to say all of them in Australia. Notional value of the service is $50k per MW per year prorated to the appropriate battery power rating.
- Energy costs – to avoid the added noise of retail rates and margins both the BTM and FTM batteries are buying and selling against their respective wholesale markets. We’ve used the last 12 months of the NEM NSW spot price and the WEM balancing price as our wholesale price signal.
- Capacity market – batteries in the WEM are able to capture value associated with the capacity market. FTM asset can earn Capacity Credits. BTM assets can mitigate capacity market related costs by managing down the Individual Reserve Capacity Requirement (IRCR). FTM asset earns Capacity Credits based on a 4-hour duration battery in line with the draft rules for battery storage offered into the capacity market.
- FCAS – batteries in the NEM are able to capture value associated with the contingency FCAS markets. In this case we’re assuming the batteries are enabled into the 6-sec and 60-sec raise services. Our FCAS price signal is based on the previous 12-months of actual market data with prices derated to 70% on the basis that our historical dataset includes the unusual events of Q1 2020.
Control strategies
The way the batteries are operated is obviously a hugely important part of the analysis and it’s easy to skew the results in a particular direction by tweaking which assets are chasing what value. In this case we’re mimicking the battery control approaches that we think are most plausible given the batteries’ locations. That means that our BTM assets are primarily focussed on reducing network charges, and then for the WEM assets mitigating IRCR charges and for the NEM assets providing contingency FCAS support. For our FTM batteries they are chasing wholesale market arbitrage and then for the WEM assets are capturing capacity credits and for the NEM assets again providing FCAS support. All scenarios require the battery to provide the network support services during spring and autumn as described above.
Results
The graphic below shows the estimated cashflows relative to business as usual associated with each scenario over 12 months with the net position represented by the black reference line and label.

Overall, Scenario 5: WEM BTM + Solar delivered the greatest return of the six scenarios. The primary sources of value were the mitigation of IRCR costs and reduced network charges. The addition of a co-located solar PV system created a ‘peakier’ load shape by hollowing out middle-of-the-day grid demand which meant the battery could be more effective at reducing network demand charges. You can see the interaction of battery and solar in the graphic below which shows one week’s worth of data from the simulation

Of the FTM batteries, the asset located in the NEM was the comfortable winner with the difference coming from wholesale arbitrage. This isn’t a surprise given the NEM is a far more volatile and extreme energy market than the WEM. In terms of other value for FTM assets the contingency FCAS in the NEM delivered similar commercial benefits to Capacity Credits in the WEM.
What about battery health?
Battery workload is often overlooked in conversations around storage projects, but just just like the battery in your laptop computer or mobile phone the lithium-ion batteries being deployed for energy storage projects degrade with use and over time. The harder the batteries are worked (frequency and depth of charge and discharge) and the longer they’ve been deployed in the field the less capacity they will have.
The dataset on real-world degradation is still very limited since the technology is so new, and so we’re obliged to rely on the tech specs from the battery vendors to guestimate how well and for how long a given asset might perform. A common way for battery vendors to warrant their products is by number of charge/discharge cycles or by total energy throughput. With this in mind we thought it would be interesting to view our hypothetical BTM and FTM assets through the lens of battery health, or in other words, how hard are the batteries having to work to create value.
The graphic below shows a full 12-months of simulated State-of-Charge for each battery together with the cumulative energy discharged (right hand axis with the annual total in red). What’s clear in this case is that the batteries chasing wholesale market benefit are working continuously as there’s are always arbitrage opportunities to be had. Those BTM focussed on network costs (+ IRCR (WEM) or FCAS (NEM)) undertake a fraction of the workload, with the BTM batteries co-located with solar working a little harder as there’s some solar self-consumption to take care of.

The wrap
Hopefully this quantitative analysis of BTM vs FTM storage has provided some interesting insights for those folks grappling with the question of where best to locate storage assets. As I mentioned up front, we’ve replicated some specific real-world scenarios here to try and illustrate how value capture might play out, but the results are of course highly dependent on the assumptions we’ve made and, as is often the case with DER projects, the devil is in the detail.
Customer specific considerations such as market jurisdiction, network tariff structures, and for BTM assets the underlying load shape of the site, all have a significant bearing on the likely commercial performance. DYOR. Having access to a good tool for simulation and optimization of DER projects could help 😉

Pete Tickler

